

Contents
Deprioritizing mobile app performance is no longer a luxury companies and mobile teams can afford. With a huge variety of apps available, functionality is no longer the only key metric users look to when downloading an app. Despite this, according to a study by PacketZoom, 70% of the users are still experiencing performance issues and 75% of these issues are network related. Given the research, mobile application performance monitoring, specifically network performance monitoring, is an important part of keeping tabs on your app quality.
Network calls play a huge role in the speed and responsiveness of your app. Another study shows that to be competitive, your app should respond to user requests within 1 second. It also indicates that many apps fail to meet that due to unreliable or slow services.
Network performance monitoring focuses on delays and failures caused in the app as a result of network requests. Why is this important? Because even when talking about business numbers, delays cause a lot of lost revenue. The same study by Packet Zoom says that 63% of users abandon an app that fails to start within 5 seconds and, according to this data, the Average Mobile Apps CPI is around $0.65. This means that a 5-second delay could represent an average loss of $0.41 per user. Thus, for 1 second of delay, the loss would be $0.08 per user.
A lot of factors can go into your app’s network performance. Some are in the mobile developer’s control, but unpredictable issues can still occur from the users’ side. By monitoring your network performance you can take a proactive approach to improve response times and get ahead of issues before they affect users.
Traditionally network performance monitoring was done purely from the server-side. While it is important to monitor server-side network performance, it doesn’t represent the whole story. Tracking response times and errors from your users’ standpoint will also offer key insights about your app’s performance and quality. Monitoring both will help you determine whether your app’s overall network performance is poor, average, or good.
With the Instabug SDK, you can track the full round trip of your network requests as seen on the client-side and be alerted to timeouts and issues. To help you identify and act on issues faster, you’ll be alerted about common network failures. For even more control and visibility, you can also track custom URL patterns. And with different filtering options, you can easily spot trends and pinpoint where problems are coming from.
.webp)
Diagnose and detect common network issues
Similar to the other metrics Instabug APM tracks there are specific elements to network performance that can help you quickly diagnose and detect issues.
There are a couple of common issues that result in network issues from the client-side. If a user is using an unreliable cellular network or a carrier with constant issues it can easily be detected by filtering as shown in the screenshot below.

Get more details with client-side failures
Normally any APM tool will be able to highlight network failures from the server-side. But Instabug APM takes it a step further by also highlighting whether the network failure was from the client-side. This helps you determine at a glance whether the issue should be assigned to the backend team or mobile team.

URL patterns
Instabug APM uses URL patterns to group similar network call occurrences in order to aggregate their numbers. There are different components to URL patterns and Instabug detects them automatically. However, you can also create your own custom URL patterns to have even more control.

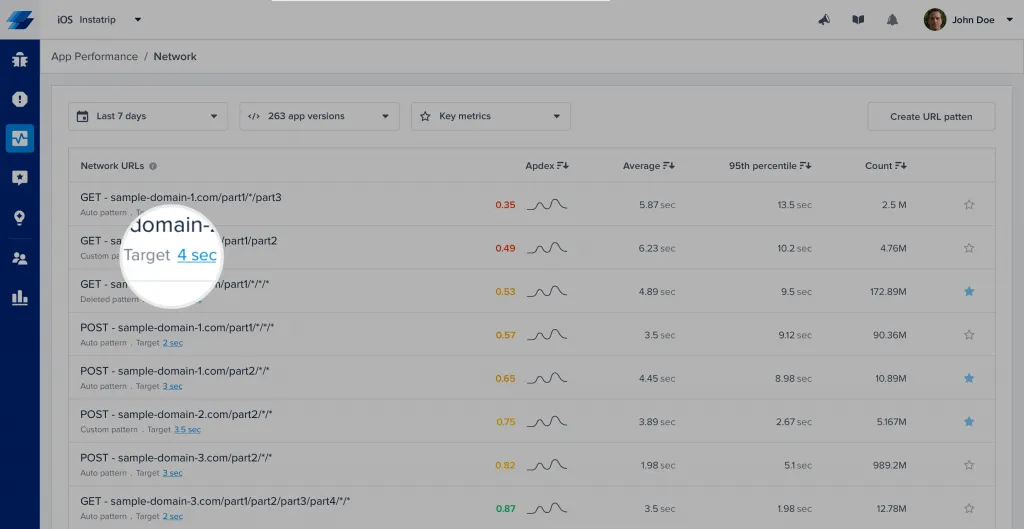
Customize network failure threshold
Instabug APM gives you one north star metric that helps you determine what kind of experience your end users are having. The app Apdex score is comprised of every granular metric affecting app performance. In the case of network performance, each occurrence has its own score determined by hitting a certain threshold.
By default, the failure threshold is set to 2 seconds. However, you can easily change this number from your dashboard by clicking on the action highlighted in the screenshot below.

Want to try our latest AI features?
Sign up to the closed beta now
Oops! Something went wrong while submitting the form.
Learn more:
- Mobile App Network Performance Monitoring and Debugging Guide
- Debugging Network Performance With Instabug: Isolate and Resolve Issues Faster
- How to Improve Mobile App Performance
- Mobile App Quality: An Essential Guide
Instabug empowers mobile teams to maintain industry-leading apps with mobile-focused, user-centric stability and performance monitoring.
Visit our sandbox or book a demo to see how Instabug can help your app


