

Contents
If your app is having mysterious performance issues, you can count network issues among the list of possible suspects. More than half of mobile application performance monitoring users are primarily looking for answers to their network performance issues. So how do you use APM to diagnose and fix problems? A proper application performance monitoring tool will give you deep insight into both server-side and client-side performance and help you target potential issues. Read on to find out more about the network-related factors that could be influencing your app performance and how network performance monitoring can help you solve them.
Throughput
Throughput is one of the first things you'll want to check out when you're debugging app network performance issues. For applications, your throughput is the number of requests that have been processed within a given time interval. This is counted in occurrences.
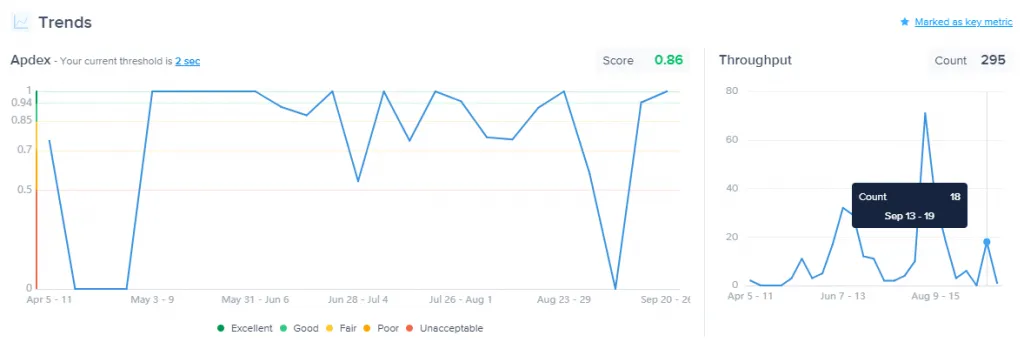
Knowing how much traffic you're experiencing will help you pinpoint possible causes of network latency; you’ll want to know how many users are downloading specific resources at the same time. In many cases, latency can be attributed to spikes in usage — many users requesting the same resources simultaneously will cause network congestion. Monitoring your network traffic can help you figure out why things are moving slowly.
Payload size
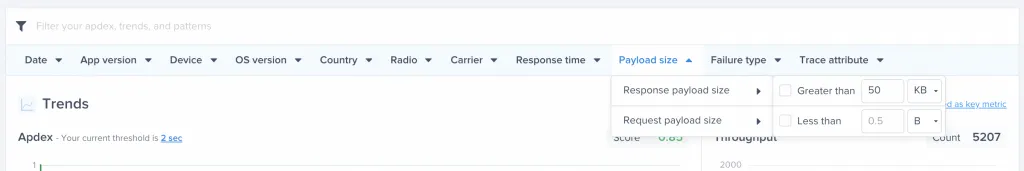
When you’re debugging network issues, one of the first things you’ll look at is the payload size. If you’re able to identify that the network delay is due to the payload size, from there, you can work on solutions to address the situation directly, whether it’s size reduction, caching solutions, or something else. Tackling a payload size issue will improve the overall user experience.
Payload size isn’t a one-dimensional metric. Your APM tool should give you insight into both the request payload size and the response payload size for complete visibility. Most tools only monitor the response or total payload size, which puts you at a disadvantage if you’re actually trying to debug the issue rather than simply monitor it. Simply looking at the response or total payload size won’t give you a straightforward answer, as frequent or numerous requests will also return large numbers for payload size. Being able to view requests is necessary to understand the full picture.

Trace attributes
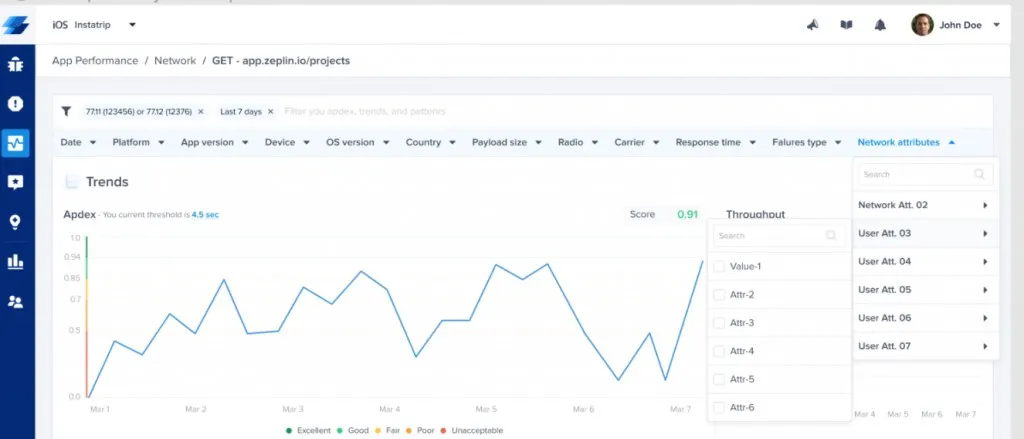
When debugging network issues, you’ll want to be able to validate if the network delay is due to specific parameters in your request. To do that, you’ll need to add attributes to your traces through an API.
Some of the things you may want to track could include HD vs SD images or videos, image size and the number of pixels, and so on. You can track parameters from your requests such as usernames or user IDs, customer subscription plans, number of returned items in a list, and more. You can also use trace attributes in A/B testing by adding experimental attributes. Every app is different, so your APM tool should allow for custom traces that reflect your needs.
You can find more information on adding trace attributes here.
Server-side and client-side failures
Network failures can cause frustrating performance issues and should be identified and corrected as quickly as possible. You don’t want your users to see blank screens or error messages.
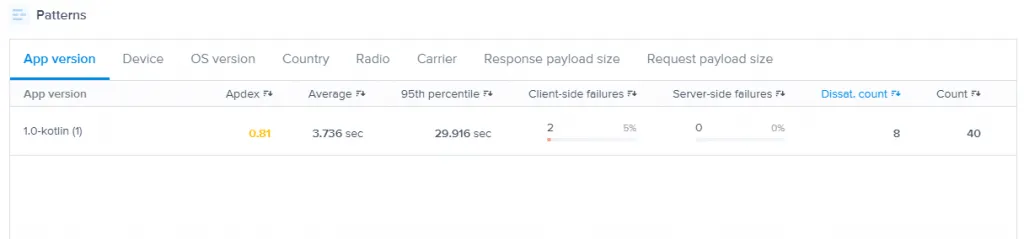
In order to get full visibility of the issue, you’ll want to monitor both server-side and client-side requests for failures. Traditionally, network performance monitoring was done purely from the server side. While still important, server-side-only data doesn't give you the full story. The other half of it is tracking response times and errors from the user's standpoint. This data is necessary for you to understand how your app is performing. If network failures on either side are involved, you'll want to know.
Network call grouping
You can have several different URLs for related network calls. Automatic grouping logic is an important feature for APM tools as it'll slash the amount of time you spend sifting through network requests looking for issues.
Instabug sorts URLs automatically so that relevant requests are grouped together. URL patterns are used to group relevant network calls; this reduces the noise on your dashboard and makes patterns in your data easier to spot. You can also create custom patterns for Instabug to track, so you can monitor what’s specifically important to you. This is especially helpful if you have complex URLs in your app containing variable strings. You can learn more about custom URL patterns and grouping logic here.
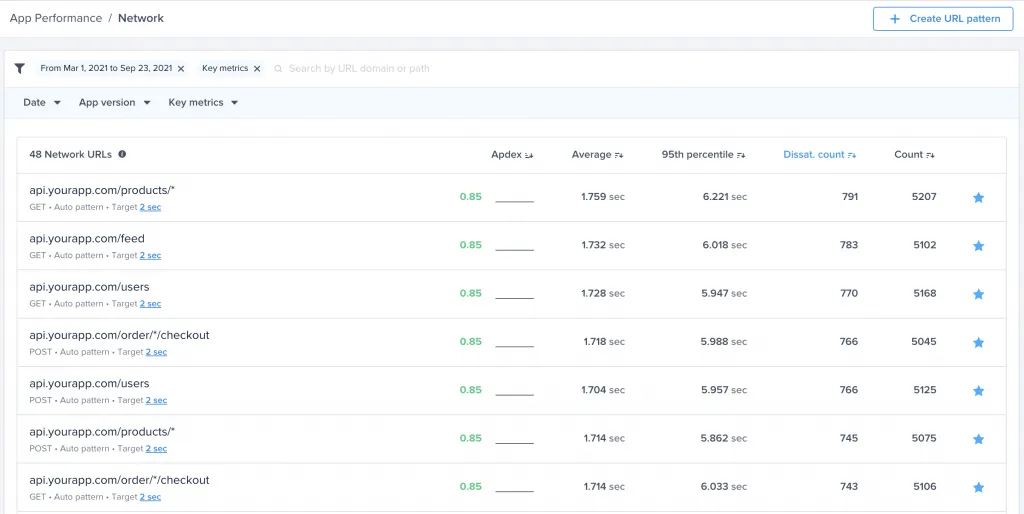
Grouping URL patterns together results in a cleaner, more efficient monitoring and debugging experience. Instead of looking at individual URLs and manually sorting them, you’ll get them grouped together and see aggregated patterns, allowing you to spot issues immediately.
Final thoughts
Using a specialized APM tool will give you quick and complete visibility into network performance issues, making debugging take a fraction of the time. By monitoring your throughput, you’ll know if usage spikes are affecting performance. Payload size is another factor that can have an impact on traffic speed. Your network performance monitoring tool also needs to track both client-side and server-side requests for failures—severe occurrences that should be addressed as soon as possible. In addition, monitoring specific traces will let you see what’s performing acceptably and what’s slow. Finally, your APM tool should be able to group your data in a way that makes finding patterns quick and easy. Instabug makes debugging easier and much faster by giving you a comprehensive analysis of your mobile app’s network performance at a glance.
Want to try our latest AI features?
Sign up to the closed beta now
Oops! Something went wrong while submitting the form.
Learn more:
- App Launch Optimization: How to Resolve Slow Startup Times
- Mobile APM Best Practices: A Guide to Application Performance Monitoring
- Mobile App Quality: An Essential Guide
- Debugging Network Performance With Instabug: Isolate and Resolve Issues Faster
Instabug empowers mobile teams to maintain industry-leading apps with mobile-focused, user-centric stability and performance monitoring.
Visit our sandbox or book a demo to see how Instabug can help your app


