

Contents
Network errors or delays are among the worst-case scenarios for app users, and consequently, developers. But capturing, diagnosing, and debugging network issues with Instabug Application Performance Monitoring makes mitigating these issues simple and straightforward.
Read on to learn more about how to use the network performance monitoring features that make identifying and debugging issues easier than brewing a cup of coffee.
Getting started
To configure Instabug’s Application Performance Monitoring features to capture network requests, follow the instructions in the documentation to activate the necessary plugin (iOS, Android, React Native, Flutter). Once you enable the plugin, network request monitoring will be turned on by default. You’ll also find instructions for additional customizations, including activating gRPC logging and setting trace attributes.
Network list page
After you’ve customized your settings, proceed to the network list page. This page provides a quick overview of the network URLs you’re tracking and any changes in performance. By default, it shows data from the last seven days; you can adjust your dates and filters at the top of the page. Using the search bar, you can also locate specific requests.
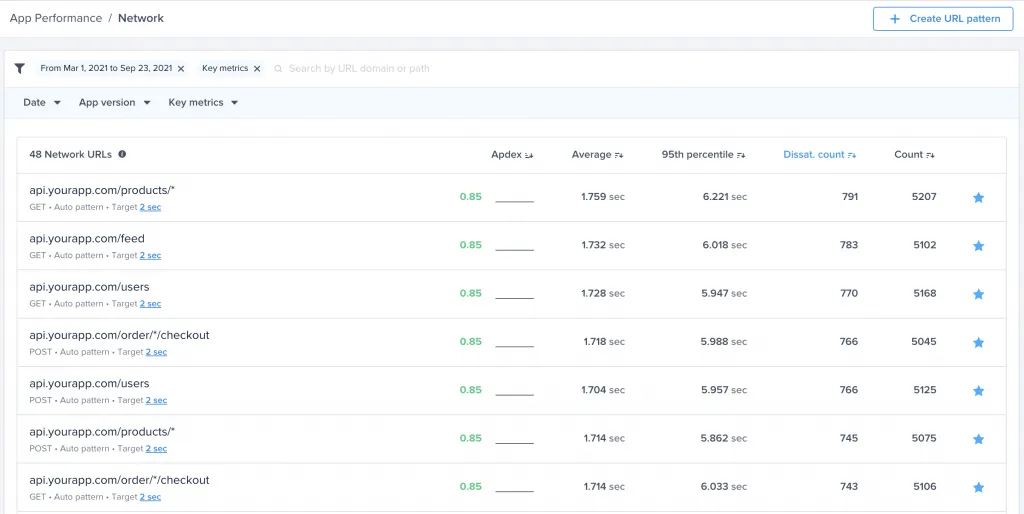
Apdex scores are the logical place to start when checking for regressions in performance. If an error occurred, you’ll see a drop in your Apdex score and the percent change from the prior week.
You can prioritize network issues by the number of users affected or the severity of the issue. The Dissatisfied count metric tells you how many of your app users are experiencing the issue. Sorting by dissatisfied count is a way to quickly prioritize high-impact issues.
To sort by severity, you can arrange your dashboard results by the percentage of network failures. From the filter bar, choose the type of failure (client-side or server-side) and specify the data range.
Finally, to reduce the amount of noise on your dashboard, Instabug sorts and groups calls automatically so that relevant requests are presented together and indicated with a *. You can also specify and track custom URL patterns, which is especially helpful if you have complex URLs containing variable strings. Read more about custom URL patterns and grouping logic in our docs.
URL trends
To inspect an individual trace for errors, click on the URL from the network list page. The Trends page gives you an array of information to spot and debug performance issues related to a specific request.
Apdex
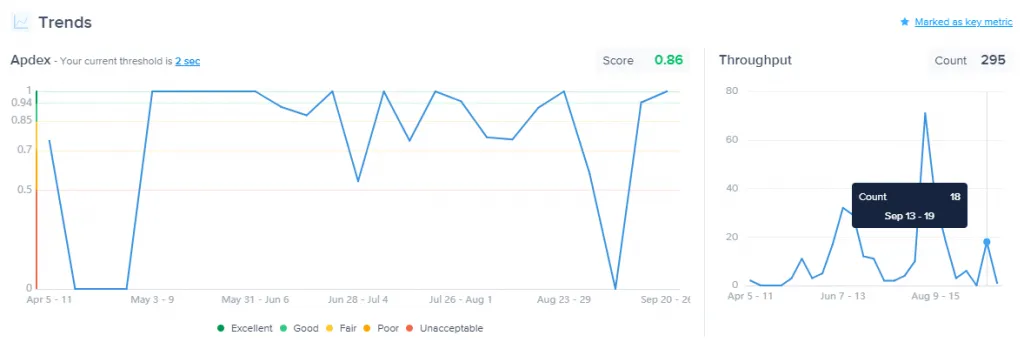
The Apdex timeline graph conveys an idea of a trace’s recent performance at a glance. Any regressions will show as a drop in the Apdex score. You can learn more about Apdex and setting thresholds in our post: What Is Apdex? All About the Metric That Measures App Performance.
Throughput
Throughput shows you how many requests have been made within a given time interval. In many cases, spikes in usage may precipitate latency. Many users requesting the same resources simultaneously can cause network congestion.
P50
The P50 chart depicts the average performance of the request over time as measured in seconds. The distribution tab shows the number of occurrences for any given duration.
Failure rate
Instabug APM monitors both server- and client-side requests for failures. Typical APM tools are focused on server-side data, but that only offers half the app performance equation. By tracking client-side performance, too, you’ll unveil slow response times and errors from the user standpoint. Monitoring both client- and server-side failures is necessary for a complete understanding of your app’s network performance.
Patterns
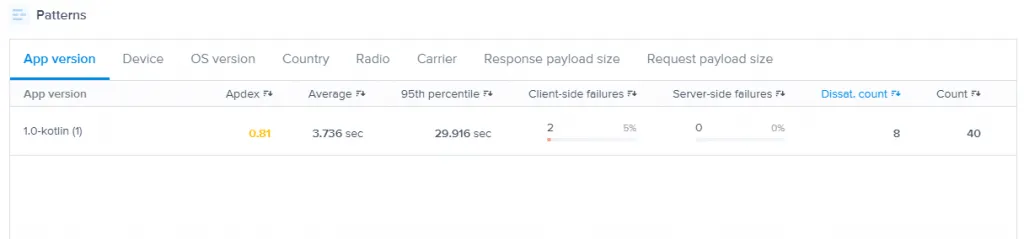
Observing patterns can help you isolate specific performance issues. Automatic pattern identification makes it easier to identify the sources of network delays. Instead of manually searching for outliers across your data, Application Performance Monitoring will point out patterns, including performance stats and Apdex impact.
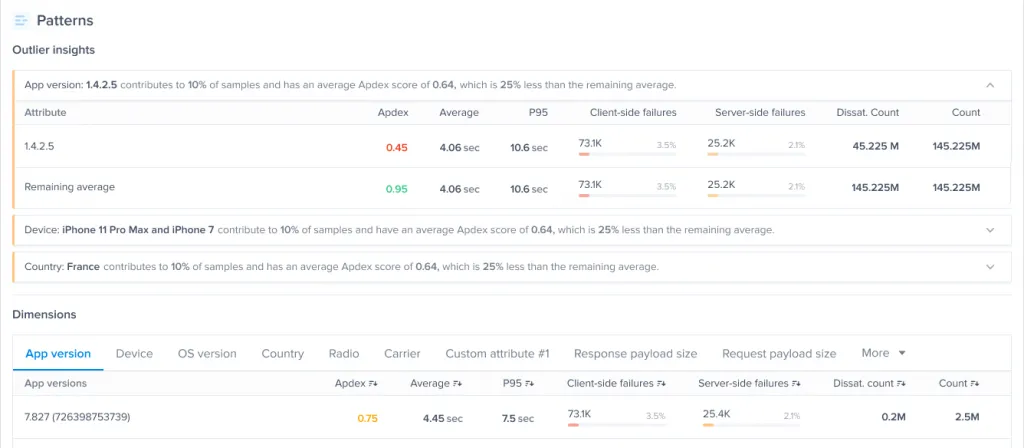
Dimensions
Instabug gathers and groups data from multiple dimensions, including app version, device, OS, app status, attributes, and custom experiments.

Among the dimensions listed, payload size is likely to be one of the first areas you examine when confronted with network issues. If the payload size is the source of an issue, you can explore other solutions, such as size reduction or caching. Instabug APM shows you both the request and response payload sizes, rather than grouping them together as a total payload size—making it easier to track the whole picture.
Setting alerts
The key to fixing performance problems before they impact your audience is to detect them as soon as possible. Performance alerting is the foundation of a robust app performance management strategy.
For example, you may want to establish alerts when a network request exceeds an average response time of two seconds, or failure rates rise above 5%. From the Rules menu, you can set your own network performance quality thresholds and receive immediate alerts for failures.
For a step-by-step guide to setting alerts, check out How to Set Alerts with Instabug: Get Notified of Performance Issues
Swift issue resolution keeps performance high
Network performance monitoring with Instabug will help you diagnose and address issues swiftly. You can also troubleshoot other performance problems with APM, such as slow app launches. For further information regarding performance thresholds and targets, check out APM KPIs: Mobile App Performance Monitoring Metrics and Targets.
Want to try our latest AI features?
Sign up to the closed beta now
Oops! Something went wrong while submitting the form.
Learn more:
- Mobile App Network Performance Monitoring and Debugging Guide
- How Much Your Mobile App Performance Costs Your Business
- Performance Monitoring and User Experience for Mobile App Growth
- Mobile App Quality: an Essential Guide
Instabug empowers mobile teams to maintain industry-leading apps with mobile-focused, user-centric stability and performance monitoring.
Visit our sandbox or book a demo to see how Instabug can help your app


