

Contents
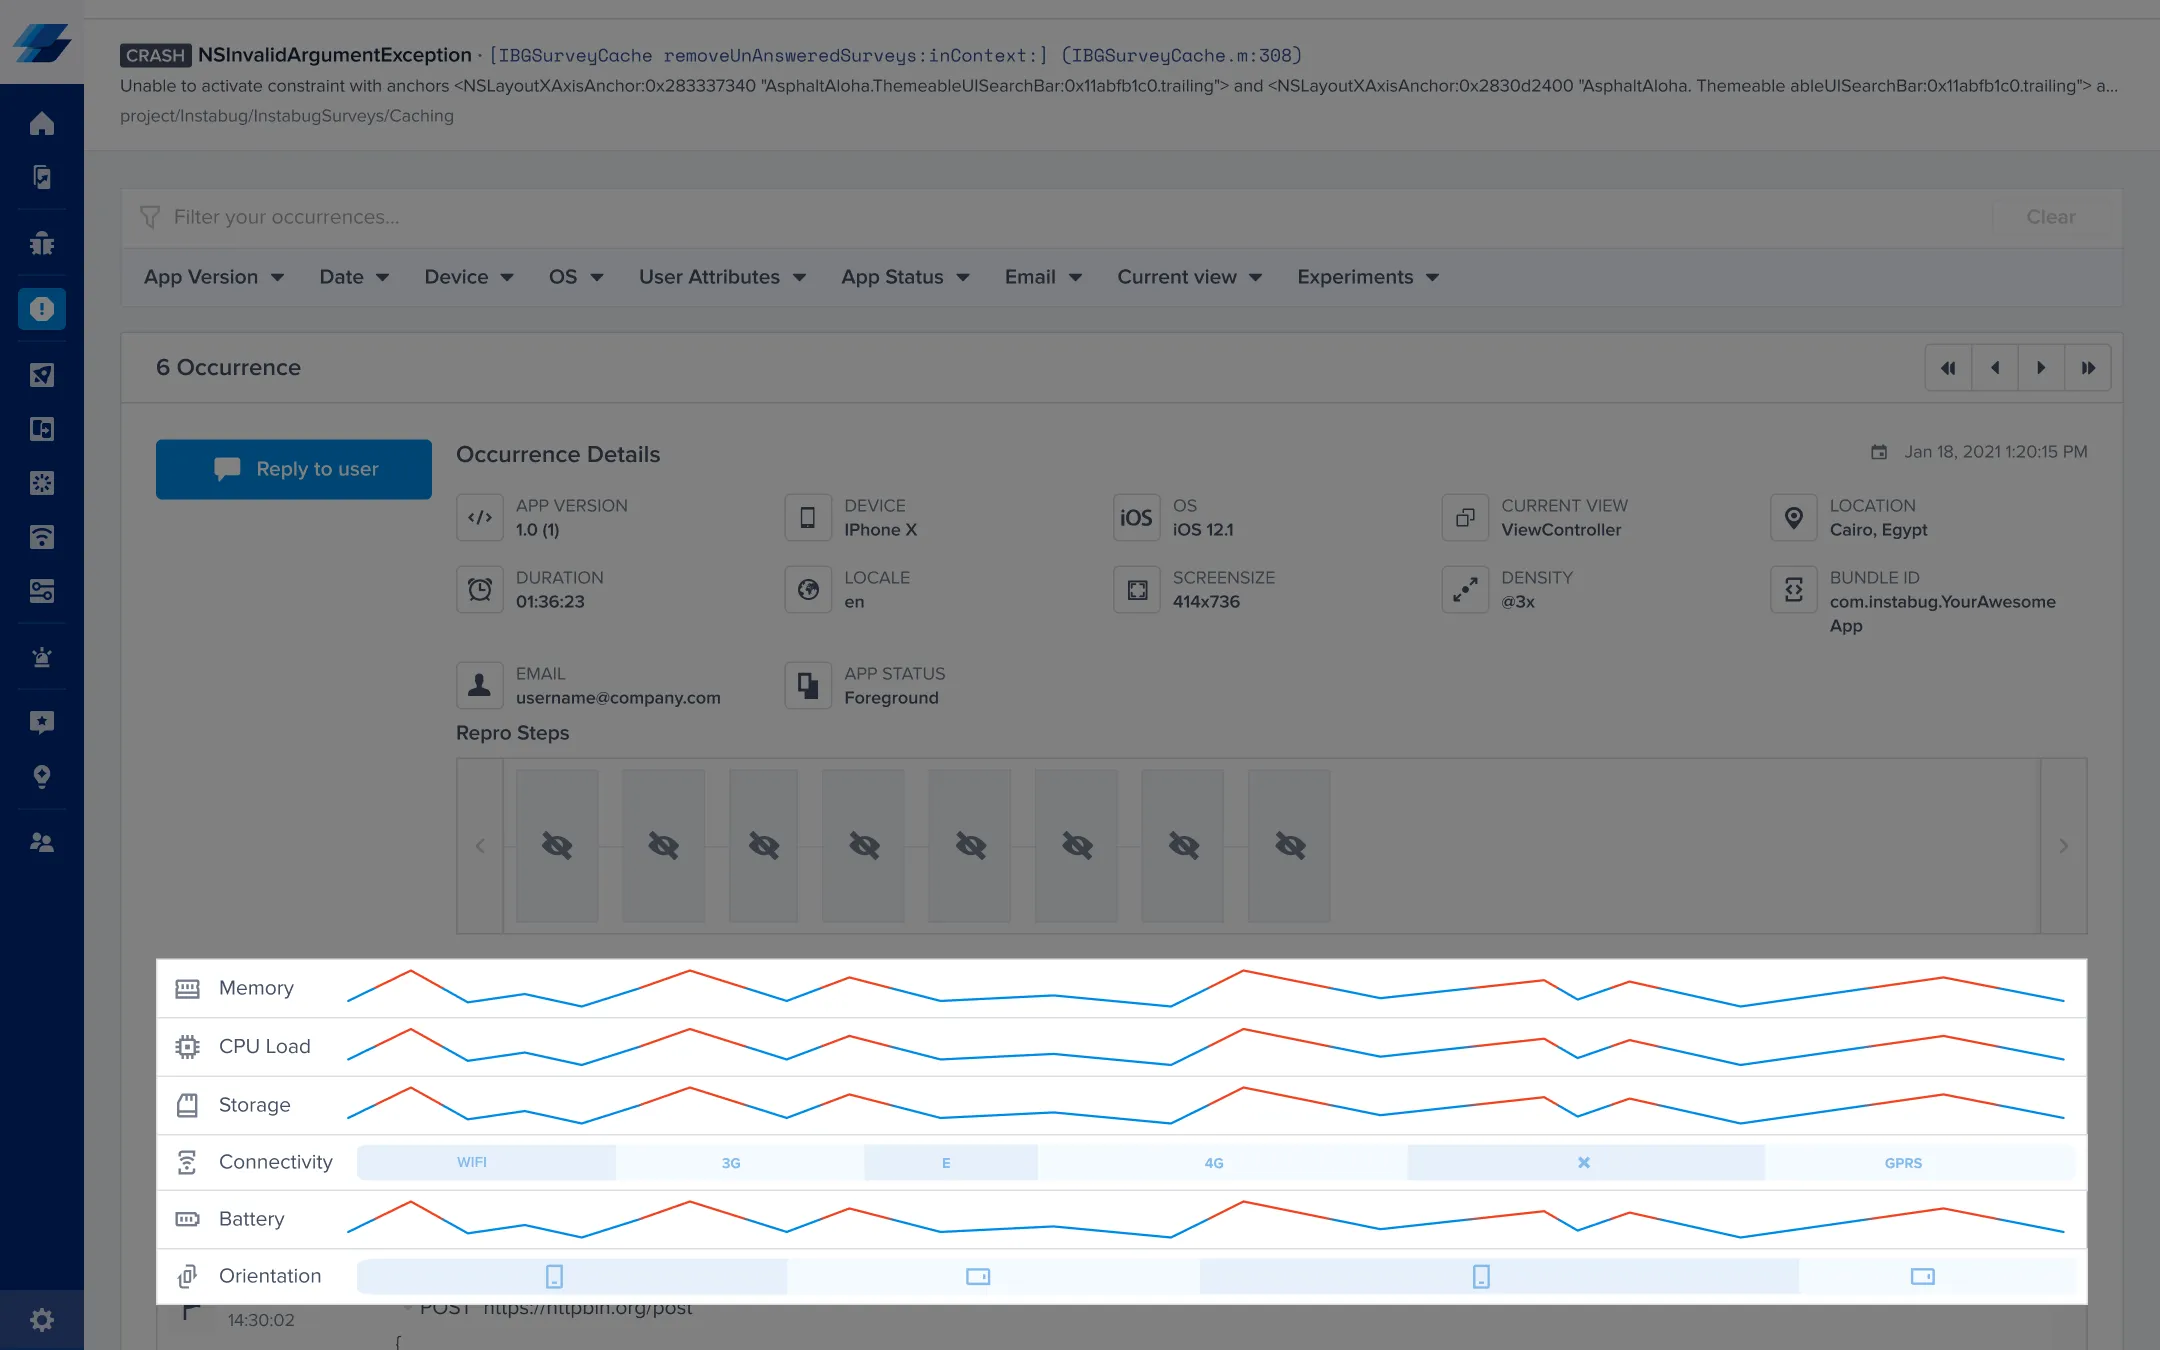
Real-time crash reports from Instabug include a session profiler that provides additional context on an app crash. These graphs capture the state of the device as well as your app in the 60 seconds before a report is sent, and highlight the most common causes of app crashes.
It's imperative that crashes are handled as fast as possible. Instabug's crash reporting tool allows you to stay on top of your app's stability and quickly resolve the crashes your app is facing by helping you figure out the causes behind them. Instabug features such as comprehensive logs, user steps, and the ability to filter similar crashes help developers quickly find the reasons behind crashes and resolve them ASAP.
With a quick skim, you can check all the graphs in the session profiler to better understand the environment in which a crash occurred. Spikes and outliers are highlighted in red, helping you judge what might be the cause of the issue.
Now let's go over the different attributes highlighted by the Session Profiler, which are directly related to the most common reasons for mobile app crashes.
CPU usage
This graph shows the CPU usage of your application. You can hover over the graph to show the exact % CPU load of the app, recorded in 0.5-second intervals.
CPU usage is a key ingredient when it comes to app crashes. Faulty software development practices like over-complicated code or resource mismanagement can lead to irregular CPU usage or consuming too much CPU power, causing your app to crash.
Memory usage
This graph shows the memory usage of your user's device. You can hover over the graph to show the exact % memory usage, recorded in 0.5-second intervals. The total amount of memory available is also shown.
Memory usage is one of the biggest problem areas for apps. Devices have different RAM capacities and developers need to keep that in mind. Your app won't be the only thing running on a user's device. Too many threads or using memory with heavy data often lead to apps crashing. Seeing your app's levels of memory usage will help you assess easily if it's the reason behind a crash.
Storage
This graph shows the percentage of storage usage on your user's device. You can hover over the graph to show the exact number compared to the total amount of storage available, recorded in 0.5-second intervals.
This problem is similar to that of memory usage, but in this case, it has to do with non-volatile memory. Some apps might take up way too much storage, or in some cases, there just isn't a lot of storage to work with. App developers need to be mindful that storage space might be limited. If mishandled and storage space runs out, a crash will occur.
Connectivity
This graph shows the connectivity details of the user's device, including WiFi name, cellular connectivity type (GPRS, Edge, 3G, LTE, or CDMA), carrier name, or "No connection" if there is no network connectivity, recorded in two-second intervals.
While developers usually have a constant and stable WiFi connection in the office, app users in the wild are constantly transitioning between different networks with varying levels of speed and stability as they move through their day. They can experience spotty connections and network drops in the middle of trying to get some data in your app or after submitting something and waiting for a response. Seeing a device's connectivity levels before a crash can reveal whether the cause is a network-related issue.
Orientation
This graph shows the orientation state of your application, portrait or landscape. You can hover over the graph to see the orientation captured every two seconds.
While it may seem innocuous, orientation changes are one of the main causes of app crashes. Often overlooked, orientation changes need to be handled well in code and for various devices. Seeing an orientation change right before your app crashes signals that you should investigate, as it could be a reason behind the crash.
Want to try our latest AI features?
Sign up to the closed beta now
Oops! Something went wrong while submitting the form.
Learn more:
- Using Symbolication to Get Better iOS Crash Reports
- Using Deobfuscation to Get Better Android Crash Reports
- Prevent Churn by Replying to Crash Reports
- Manual Crashing to Get the Most Out of Crash Reports
Instabug empowers mobile teams to maintain industry-leading apps with mobile-focused, user-centric stability and performance monitoring.
Visit our sandbox or book a demo to see how Instabug can help your app


