

Contents
In part one of this post, we explored some important optimization strategies to help you improve your app’s stability and performance. This post will take it further and focus on optimizing the performance of your UI to deliver a smooth, premium app experience.
UI hangs
UI hangs occur when your app’s UI becomes unresponsive to user input for an extended time. It’s normal for there to be a delay between user input and UI response, but once that delay reaches 100ms, it becomes noticeable; if it exceeds 250ms, it will start to frustrate your users.
Let’s take a look at some guidelines and best practices to avoid UI hangs and improve your UI’s performance.
Test on low-end devices
In most cases, the majority of your app’s users will be operating mid-range to low-end devices. If you limit your testing to high-end devices, you will miss a variety of performance issues that only occur when the CPU, GPU, and memory are more restrictive.
Free the main thread
Your app’s main thread must remain as unrestricted as possible, and you should offload any non-UI-related work away from the main thread as soon as possible—this is a general best practice for mobile app development.
If you need to reflect the result of a process on the UI, always try to notify the main thread through mechanisms like callbacks and observers instead of running it on the main thread.
Switch coroutine context
Kotlin coroutine does a great job of handling threads on Android, allowing you to easily switch between threads to perform different operations. Some popular libraries like Retrofit and Room can internally change a coroutine’s context to a background thread.
If you’re using a similar library, avoid delegating the switching of coroutine contexts to the library itself. This will cause any work done after executing the library’s code but before the coroutines end to be handled by your app’s main thread.
Manage rendering load
We’ve mentioned avoiding high-resolution images unless necessary before, but we can’t talk about UI hangs without bringing in rendering load. High-resolution images place a significant load on the GPU, lowering rendering speed and decreasing UI responsiveness.
Optimize recycler view items
The recycler view is a common source of UI hangs on Android, but the problem doesn’t lie in the recycler view component itself. In most cases, the underlying reason is the use of unoptimized items.
While a single item in the recycler view might not present a huge load on the device, recycler views can contain multiple items that need to be rendered, and the number of items can increase as the screen size and resolution increase.
Always keep the number of items in the recycler view and their total size in mind to make sure they can be rendered with reasonable speed.
Dropped frames
Dropped frames are a likely indicator of performance issues. Detecting and investigating them can serve as a good starting point for fixing any major performance issues with your app’s UI rendering.
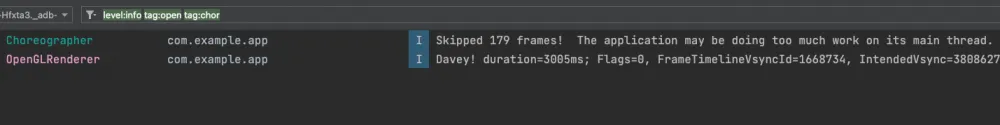
There are many ways to detect dropped frames in Android. The most basic method is to look into Android Studio’s Logcat while the app is running. You can then filter the logs with the Choreographer tag to find instances where your app failed to render a frame for 333ms or longer, causing it to skip one or more frames.
You can also filter with the OpenGLRenderer tag, which will show you instances where your app failed to render a frame for 700ms.
Inspect UI rendering
Now that you’ve optimized your app’s code and assets and fixed its major UI performance issues, it’s time to take it further and examine your app’s UI rendering to identify janky frames.
Janky frames occur when your app fails to render a frame within the target time of 16.6ms for a device with a 60Hz refresh rate. This causes your app’s animations to stutter, delivering a less-than-optimal experience.
Android provides two different ways to inspect UI rendering performance.
On-device GPU rendering
Android’s on-device developer options include a tool that can help you visualize frame rendering performance. Running your app on a device with GPU rendering profiling enabled will allow you to view a graph representing your app’s rendering performance and identify bottlenecks.
You can read more details about enabling and using on-device GPU rendering in Android’s documentation.
Android Studio profiler
Android Studio provides some tools for analyzing your app’s frame rendering performance and detecting janky frames and hangs. Android Studio’s profiler provides more detailed information and goes well beyond frames and UI, but we’ll limit the scope to the UI in this post.
Let’s take a look at an example using Android Studio’s profiler to identify and fix a janky frame.
The example in this post uses Android Studio Dolphin and a physical device running Android 12 (API level 31). You can use the Android emulator to run the same Android version or higher.
To begin, run the target app and open Android Studio’s profiler tab. A new session should start automatically, or you can select the ‘+’ button to start a new session manually.
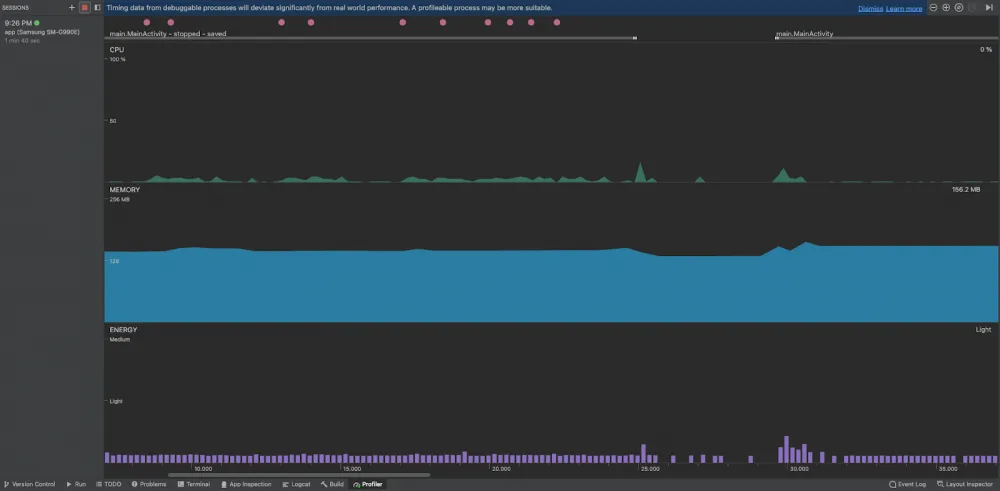
Here we can see the timeline graphs for the CPU, memory, and energy usage. Because we’re interested in rendering performance and janky frames, we’ll select the CPU graph to view more details.
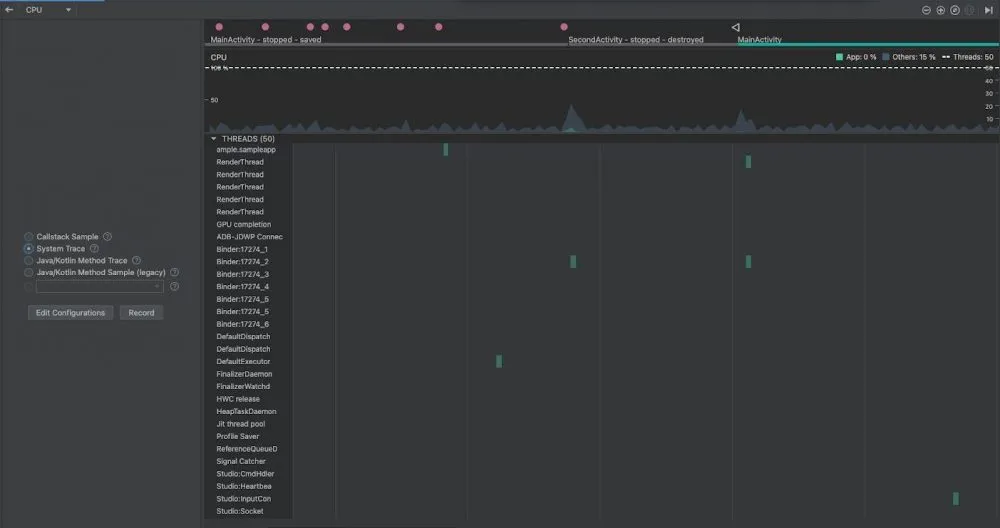
The CPU profile’s detailed view gives us more details like user input events, keyboard activity, CPU usage graph, and thread activities—whether they are active, waiting on an I/O operation, or sleeping. The sidebar also provides the option to change the collected data and record our session.
To view UI rendering performance, we’ll first enable the system trace option, then select the record button. Now, all we need is to interact with the parts of the app we want to inspect.
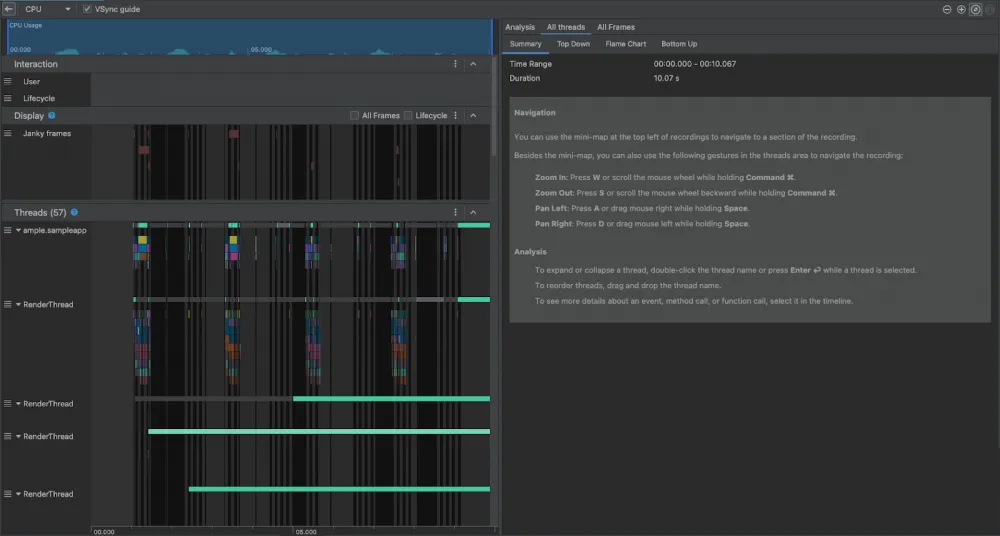
When we’re through with the app scenarios that we want to check, we’ll stop recording and give Android Studio some time to process the data. Android Studio will open the system trace view once complete.
This view includes a section that identifies janky frames and offers more details about their rendering performance. To discover the reason for a jank, we can select it from the graph and press the “M“ key to zoom in on the selected area and inspect the relevant threads.
The first thread will be the app’s main thread by default; here we can observe all the events that occurred there. With this view, we can identify the long-running operations that caused the jank. In this case, we can see an event highlighted in yellow that’s taking too long to process. This event represents the rendering of a large 4k image, which we can optimize to avoid this jank.
You can learn more about Android Studio’s profiler and its features from Android’s documentation.
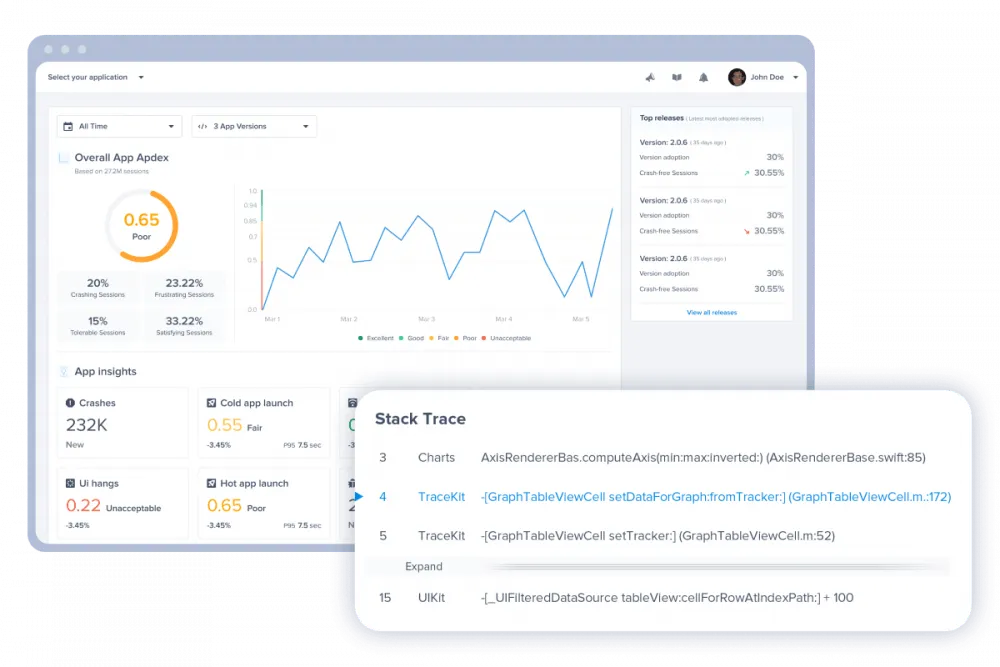
Mobile App Performance Monitoring tools
Android Studio’s profiler is a powerful tool that can help you identify and fix issues in your app, but you need more to understand your app’s stability and performance in the real world. Consider mobile App Performance Monitoring (APM) solutions like Instabug that can help you monitor and improve your app’s stability and performance as perceived by your users by giving you detailed reports on crashes, app hangs, app launches, network performance, and much more.
Want to try our latest AI features?
Sign up to the closed beta now
Oops! Something went wrong while submitting the form.
Learn more:
- SDK Development Stories: Interviews With Our Developers
- How We Migrated Our Front-End While Scaling at Instabug
- Why We Automated Our Front-End Testing at Instabug
- How We Migrated Our Massive Crashes Database
Instabug empowers mobile teams to maintain industry-leading apps with mobile-focused, user-centric stability and performance monitoring.
Book a demo to see how Instabug can help your app


